CS 104 - Lab 7
Due in Blackboard Assignment (one file named lastnameLab7.zip) Week 10
before Lab (8:35am)
put all the m-files and diary file in one zip file
Objectives:
- (16 points) Create m-file scripts/functions to solve some basic vector
problems in MATLAB
- (4 points) Matrix Problem
Tasks:
1. Create m-file scripts/functions to solve some basic vector problems
in MATLAB
A. (8 points) We have a vector of student letter grades in courses and
a corresponding vector of the credit hours for each course. Here are two
sample vectors you can use, but your code should work for any two vectors
of the same length:
grades = ['A' 'B' 'A' 'C' 'A' 'D' 'B' 'B' 'A' 'A' 'D' 'C' 'A' 'B' 'A' 'A' 'A' 'B' 'C' 'A' 'C' 'C'];
creditHours = [3 3 2 5 3 2 3 3 4 5 3 3 3 3 3 3 2 0 4 5 3 3];
Write a single MATLAB statement to create each result.
Aa. How many As did the student earn? s
Ab. Find the grades for courses worth 4 or more credit hours.
Ac. Remove any grades for zero credit hour courses.
Ad. Find the total number of credit hours for courses with a C grade.
B. (4 points) Individual ocean waves have crests (high points) and troughs
(low points). The vertical distance between a crest and a trough is the
wave height, and the horizontal distance from crest to crest is the wavelength.
The interaction of individual waves creates a set of waves with varying
peaks and troughs. If we consider two waves at a time, the combination
can be constructive interference or destructive interference, depending
if the crests meet crests or not.
To investigate the interference pattern of two waves, we will model
a wave by a sinusoid s(t) = A * sin(2*pi*f*t + phi)
where A is amplitude, f is frequency in cycles per second, phi is the
phase shift in radians, and t is time
Write a function called waveSum that takes 3 vector arguments (amplitude,
frequency, phaseShift). Each argument is a vector of two elements, one
for each wave. Calculate and plot the wave heights of the two waves combined
for t ranging from 0 to 5 by .01. Also find and return the times t with
the largest combined wave height. Here are some interesting waves to test
(plots not shown).
Here are some interesting waves to test.
>> waveSum([3 5], [1 .2], [0,0]) ans = 1.25
>> waveSum([3 5], [.25 .5], [0,pi/3]) ans = 0.2600 4.2600
>> waveSum([5 5], [.2 .5], [0,0]) ans = 0.59
>> waveSum([5 3], [1 .5], [0,pi/2]) ans = 0.2200 2.2200 4.2200
C. (4 points) A party store sells helium tanks to fill spherical balloons.
Write a function that accepts two inputs: a vector of increasing balloon
diameters in inches and a scalar of a helium tank size in cubic feet. The
helium tank cannot fill balloons with diameters smaller than 6 inches,
so your function should remove those diameters from the vector parameter
and the table displayed. The function displays a table showing the size
of balloon, volume of the balloon in cubic feet, and number of balloons
of each diameter that size of tank can fill. Volume of a sphere: (4/3)
pi r^3. The function should:
- calculate the total volume of each balloon in cubic feet
- calculate the # of balloons of each diameter the helium tank will fill
- display a of table of balloon diameter, balloon volume (cubic feet),
# of each size of balloon helium tank will fill
- Do not worry about formatting the output to a specific number of decimal
places.
SAMPLE RUN
>> balloons([8 5 12 9 2 15],25);
Diameter(in)Volume(ft^3)BalloonCount
    8.0000    0.1551  161.0000
   12.0000    0.5236   47.0000
    9.0000    0.2209  113.0000
   15.0000    1.0227   24.0000
2. (4 points) Matrix Problem
We want to estimate the amount of soil that must be removed to prepare
the foundations of a building. The first step was to survey the land which
results in a rectangular grid defining the depth (in feet) of the soil
at every grid point. The depth matrix is given below (you can copy and
paste this). The next step is to consider the drawing of the basement on
the same grid, each square in the grid represents a 10 foot by 10 foot
square. The shaded areas indicate places where the soil must be removed
to make the building foundation. Create a matrix "area" containing
a number between zero and one for each square in the grid determined by
how much of the square needs to be removed (you estimate this by looking
at the shaded grid). Then calculate and echo the total amount of soil to
be removed.
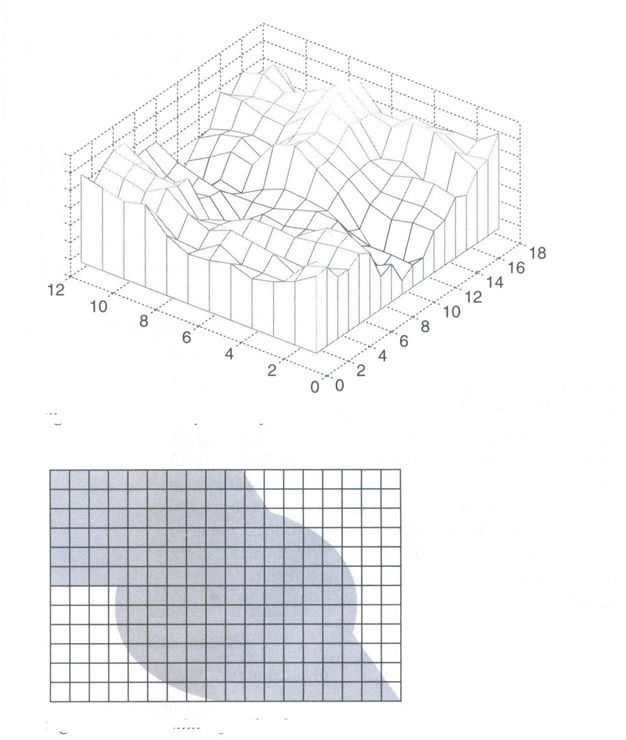 |
depth = [8 8 9 8 8 8 8 8 7 8 7 7 7 7 8 8 8 7
         8 8 8 8 8 8 8 7 7 7 7 7 8 7 8 8 8 7
         8 8 8 8 7 7 8 7 8 8 8 8 8 7 8 8 8 8
         7 7 7 8 7 8 8 8 8 8 8 8 7 6 7 7 7 7
         8 8 8 8 8 8 8 8 7 7 7 7 7 6 6 7 7 8
         8 7 7 8 7 7 8 7 7 7 7 7 7 7 7 7 7 8
         9 8 8 9 8 7 8 7 7 7 7 7 6 7 6 7 7 8
         8 8 8 9 9 8 8 8 7 6 6 6 6 7 7 8 7 8
         9 8 8 7 7 7 7 7 7 6 6 7 7 7 8 8 7 8
         9 8 8 7 7 7 6 7 7 6 6 8 8 8 9 9 7 8
         9 9 8 8 8 8 7 7 7 7 7 8 8 9 9 9 8 8
         9 8 8 7 7 8 7 7 7 7 8 8 9 9 9 8 7 8];
% 12 rows and 18 columns
|
Copyright CS, Illinois Institute of Technology